
Analyze data and images
Turn a screenshot, table, or CSV into structured data, and run the numbers where Run Code is enabled.
A screenshot of a table, a messy CSV, a photo of a receipt: NuFi can read it and turn it into clean, structured data. With an agent that has Run Code, it can also do the arithmetic and draw a chart rather than estimating in prose.
What you will need
- A model that accepts images, if you are uploading a picture.
- For calculations and charts: Run Code (and Artifacts, for
rendered output), which appear in the Tools menu only where your
organisation has enabled them.
chat.nufi.medoes not have them switched on today, so there the first two steps are the whole guide.
Steps
Attach the screenshot, photo or CSV with the paperclip, or drag it in.
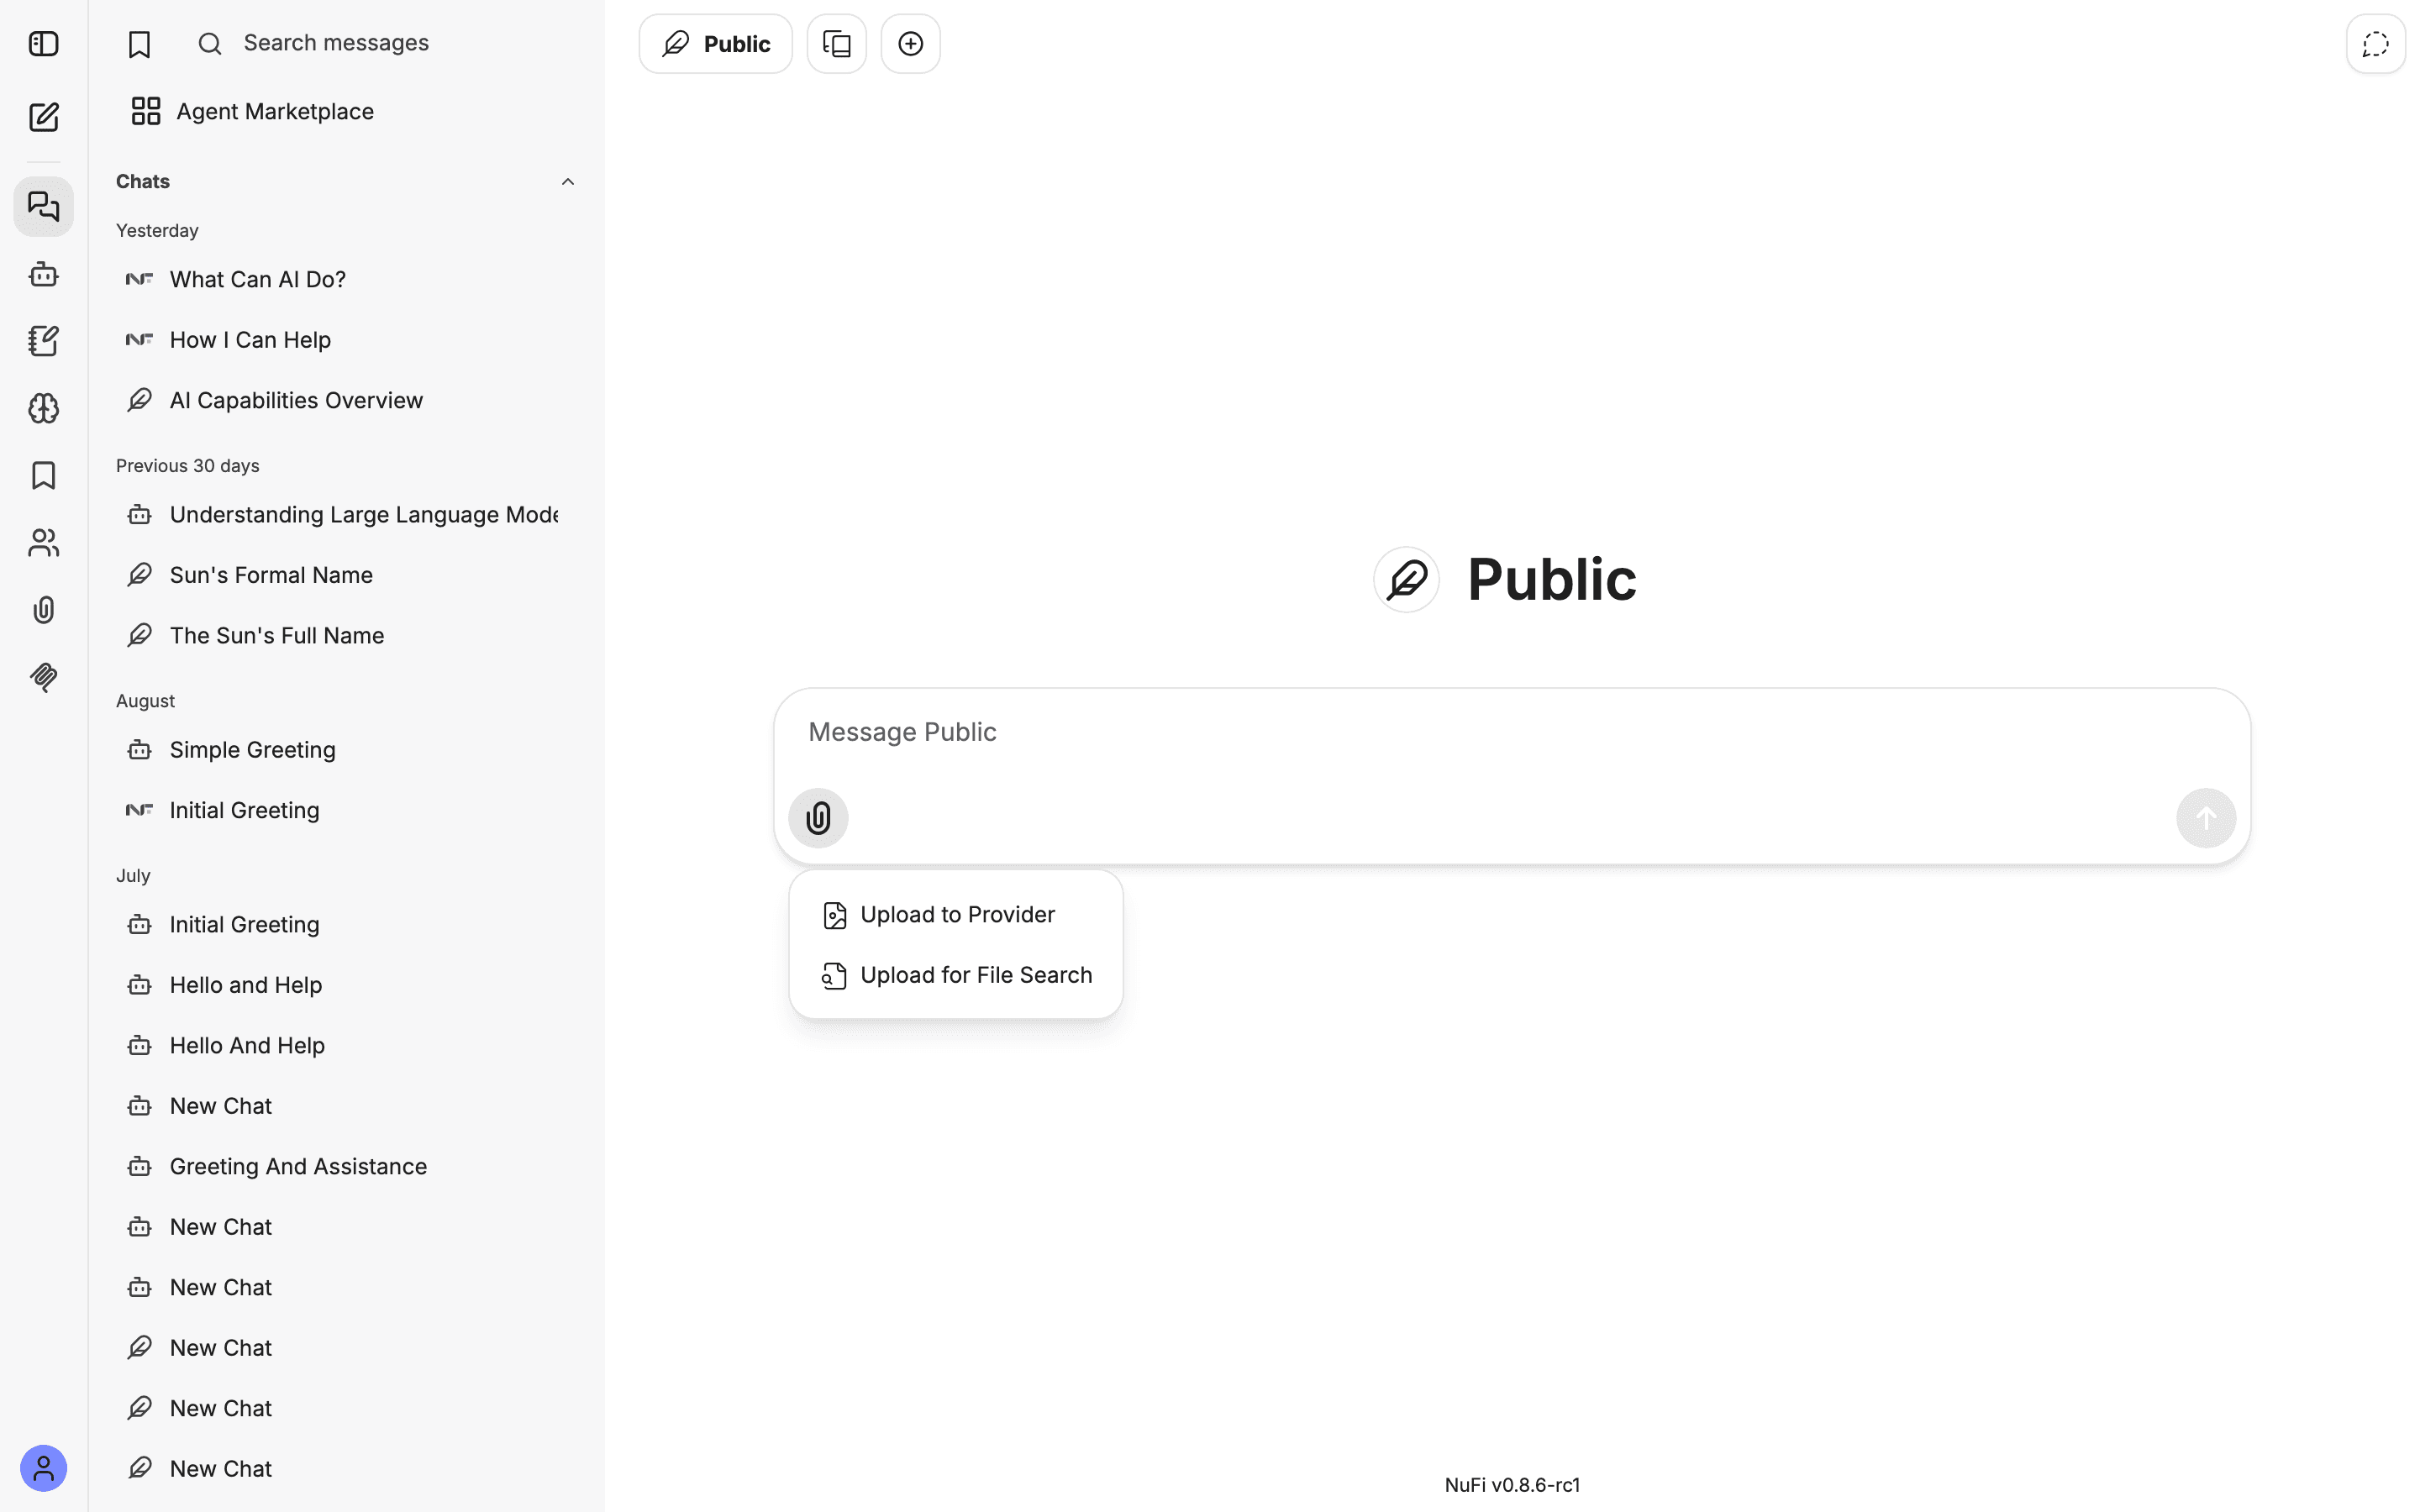
Ask for a clean shape:
Read this table and turn it into Markdown.
Extract the rows as JSON with columns date, item, amount.
For maths or charts, where they are enabled: in Advanced mode, open the Tools menu beside the paperclip and turn on Run Code (and Artifacts).
Ask for the analysis:
Compute the monthly totals and plot them as a bar chart.
The model writes and runs the code and shows the result.
Iterate:
Sort by revenue, highest first.
Export the cleaned table as CSV.
Make it better
- Say what the columns mean — units, currency, date format — so nothing is guessed.
- Check extracted numbers against the source before you trust them.
- Use Run Code for anything numeric. A model doing arithmetic in its head is a model estimating.